July 2, 2026
9 min
Learn how appointment reminders reduce no-shows, improve attendance, and optimize scheduling with proven strategies, automation, and performance tracking.
November 3, 2025
7 min
Track the KPIs that truly drive dental practice growth which are new patients, case acceptance, A/R days, and retention. See benchmarks, formulas, and a clear roadmap to improve results.

If you want to grow a dental practice, obsessing over the right numbers isn’t optional, it’s the work. And, as it happens, the fastest levers to pull are visible in your KPIs: the metrics that unambiguously expose where time and money go, and how much comes back. Here’s a guide for dental practice owners who crave clear signals, not fuzzy ideas, an actionable KPI dashboard, straightforward benchmark cues, definitions that don’t squint, and a week-by-week plan to nudge those numbers somewhere better.
This is a resource, not a sales pitch. The audience is whoever runs a dental practice and cares that progress shows up in black and white on their statements. What follows: not just what to track, but why, how to calculate it, what “good” even means, how often to look, and how to move a metric when it stalls. Use at least three months of historical data. Anything less is vanity, not signal. Article length must serve the problem: enough for clarity, not enough for boredom.

Any good dashboard starts with brutal honesty. Every KPI here deserves a single-sentence definition, a formula the front desk can use, a realistic benchmark, and a rhythm for review. You want at least three months of data to smooth out seasonal bumps (no more blaming summer for weak numbers) and set targets quarterly. Modern tools like unified data dashboards for clinics help make this easier by visualizing your KPIs in real time.
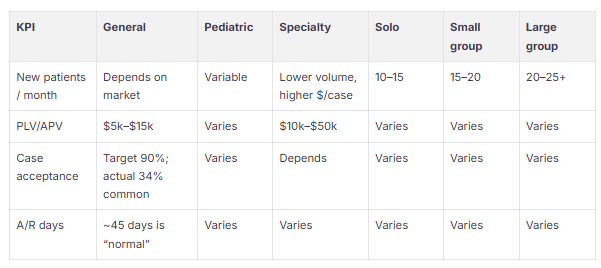
No number is sacred without context. Here’s the short list, how to track them, and why they’re not optional:
History, not hope, sets targets. Establish a 3‑month baseline, pick one to three KPIs that genuinely move the needle, then select quarterly goals, modest, not delusional (aiming for 5–10% retention or case acceptance improvement). For the 12-month view, double-digit progress, or breaking into top quartile performance, is where bragging rights start.
PLV/APV at $5–15k ($10k–$50k for cosmetic) is a sanity check for your marketing spend. If your case acceptance rate is half what it should be, the fastest solution is a better process at the close, not a bigger ad budget.
If you’re looking for ways to increase the efficiency of tracking, consider using marketing ROI analytics for dental practices to gauge financial impact directly.
The Real Tech Stack
Cadence to Stay Out of the Weeds
Dashboard Templates that Don’t Waste Time
Better Data, Smoother Implementation
How to Measure: Gather a 30‑day baseline, report the gap at every morning huddle, don’t hide from it.
How to Measure: Stack your 90‑day progress against the baseline; tune scripts, fix what fails.
What to Expect: Reminders and prebooking slash no-shows and lift hygiene production; your three-month baseline is the only honest measure (if no-shows drop by 5–8% of monthly production, you did the work).
Where do I start? New patients/month, PPV, and collections: if you don’t measure revenue and capacity, you’re kidding yourself about growth.
How do I calculate retention? ((E − N) ÷ S) × 100 (E = ending patients, N = new this period, S = starting count). It’s as clear as retention math gets.
What’s a good case acceptance rate? Targets soar near 90%; reality (by industry study) is closer to one in three. Fix process, don’t set vanity goals.
How often do I need to look at KPIs with the team? Daily for top ops metrics, weekly for operations, monthly for deep dives. Huddles aren’t optional, they set the tone.
What’s a real benchmark? Your own 3‑month baseline, plus the numbers above. Targets start with history, then chase improvement tied to growth focus.
Which tools move the needle most? Communication automation and KPI dashboards. That’s where speed shows up: DentalIntel for the workflows, ConvertLens if you want the full-stack view (CRM plus marketing ROI).
What’s “good” for A/R days? If you’re over 45 days, you’re underwater. Use aging buckets to prioritize before things become uncollectable.
How do I think about LTV:CAC? Model for at least a 3:1 ratio, it’s a simple rule that keeps your ad budget from killing profit.
What’s realistic for CAC? $150–$300/patient is the industry spread; $216 for organic, $350 for paid is a breakdown from real-world numbers. Know before you spend.


July 2, 2026
9 min
Learn how appointment reminders reduce no-shows, improve attendance, and optimize scheduling with proven strategies, automation, and performance tracking.

July 2, 2026
11 min
Learn practical strategies to improve patient retention with personalized care, better communication, staff training, CRM tools, and stronger long-term patient relationships.

July 2, 2026
10 min
Discover how DSOs can manage negative reviews across multiple locations with consistent responses, HIPAA-safe practices, and scalable reputation management systems.
Sign Up Now & Someone from Our Team Will Be in Touch Shortly!
Use the form below to send us a message, and we’ll get back to you as soon as we can.
Track every marketing dollar and optimize patient conversions with ConvertLens. Gain valuable insights from your campaigns, ensuring you never miss a potential patient. Maximize ROI and grow your practice effortlessly.
-p-500.webp)