June 26, 2026
10 min
Discover practical strategies to improve patient retention, strengthen trust, encourage referrals, and create lasting relationships that support sustainable dental practice growth.
November 4, 2025
8 min
Hidden ROI in patient retention comes from reduced no shows higher visit frequency and referral growth leading to stronger lifetime value and healthier LTV to CAC ratios. Use clean PMS and CRM data to uncover it

When you talk about hidden ROI in patient retention, you’re naming the slack in the system, the value that accrues almost invisibly as you keep patients coming back, or referring friends, or simply not disappearing. It’s not the splashy revenue from one visit, but the river of benefits that comes over time: repeat visits, referrals, smoothed overhead, utilization that doesn't spike and sag, and costs that quietly shrink because you’re not constantly reacquiring what you once already had.
A little bit more retention isn’t a rounding error, it changes your entire P&L: CAC drops thanks to referrals, LTV climbs, utilization gets less choppy, and it’s a lot easier to justify long-term investment in marketing, operations, or care pathways.
How You Actually Use Benchmarks: Start by splitting out specialty/cohort. Metrics that unlock attribution and true unit economics (LTV:CAC) are where you want to focus. Directional targets: LTV:CAC ≈ 3:1. A retention lift of even 3–10 p.p. is real money. No-show rate drops, say, 7% → 4%, are eye-popping for what they recover.
Data & Tools: Focus on PMS match rates and clean data before you get fancy. A platform like ConvertLens (or any analytics tool that ties together revenue, visits, CAC, no-shows, and referrals) will beat any spreadsheet. Call-tracking vendors report PMS match rates of 97%, which means your CAC is finally real, not estimated.
Attribution and Horizon: Use cohorts (patients acquired Q1, say) so you can compare before/after effects. Rolling windows help, too. For big changes, split test (“holdout”) before you reallocate budget. Horizons matter: 1–3 years for general clinics, 3–5+ for chronic or specialty.
Discounting and Margin: If you model over many years, discount the future using standard PV math. Always sanity-check margin (not just revenue!) when making strategic moves.
Automation and Data Health: Don’t try to do this by hand. Join your PMS and CRM data. Use a dashboard with strong match rates (97% is what to aim for) to automate CAC, visits, no-shows, and referral number-crunching.
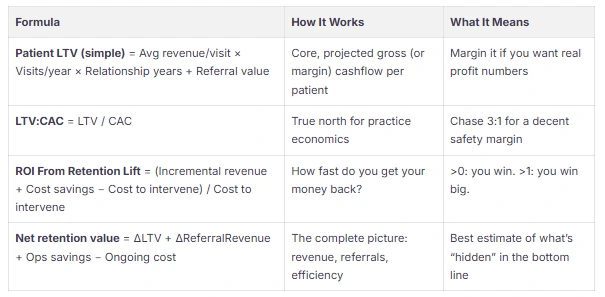
Start from patient-level data (patient_id, acquisition_channel, visit_date, revenue, status). Calculate averages and frequencies by cohort. LTV is just: average revenue/visit × visits/year × years + referral effect. Model referral effect conservatively unless you’ve got gold-standard data.
Try no-show reductions of 1, 2, or 3 percentage points. Each percentage translates directly to capacity and revenue. Say you have 2,000 appointments a year at $200 per visit; dropping no-shows by 2% = 40 more visits, $8,000 recovered. For context: dental CAC is $216 (organic) and $350 (paid).
Layer in referrals, admin time saved, and workflow/productivity bumps for clinicians. Always prioritize cohort analysis (vs overall averages) if you’re testing a new program. Final numbers feed an ROI (or finance) dashboard, have your data ready to export (CSV or via API).
Below, I’ve bucketed the moves by type. For digital tactics, be suspicious of bold claims, always calibrate with your data.
Checklist for Implementation: Validate your PMS data and attribution first, run small retention “lift” pilots, always test best/worst/middle scenarios, and focus on practical payback cycles. Consolidate reporting if possible, it saves a ton of time and yields more reliable insights.
What counts as “hidden” ROI here?
Any indirect, slow-arriving, or overlooked financial and operational bump, think LTV upticks, referrals, admin savings from fewer no-shows, or drops in acute readmit rate.
What time horizon should I use?
Match horizon to reality: 1–3 years for routine practices, up to 5+ if you do chronic or specialty care.
What’s the single best metric to monitor?
LTV:CAC, coupled with retention delta (how much retention you gain or lose). For most, 3:1 is a solid reference point.
How do I count referrals and secondary value?
Attribute them by patient cohort using conservative multipliers. If you can, use CRM or PMS to confirm source/links for real data.
What’s the absolute minimum data I need?
Avg revenue/visit, frequency (visits/year), retention, CAC, no-show, intervention cost. If nothing else, export these fields. Dashboards with PMS/CRM integration make this repeatable.
No-show benchmarks?
US average: 5–8% (all specialties). Latest dental data: improvement from 7% (2022) to 4% (2023) post-interventions.
How do I validate attribution before I shift spend?
Max your PMS/CRM data match, then do before/after or holdout tests. Anything above 95% attribution match puts you in a good spot.
Best measurement tools?
Platforms offering CRM + marketing ROI + PMS integration. Examples: ConvertLens, or niche call-tracking plus analytics setups.
When do I see the payoff?
Operational tweaks (reminders, self-book) show results in 3–12 months; more complex behavior/clinical programs unfold in 1–3 years, depending on path and cost.
If you’re serious about surfacing hidden retention ROI, standard “reporting” won’t do it. Build a measurement framework, pull atomic data from PMS and CRM, run realistic LTV math, test retention levers cohort by cohort. Start by fixing basic data hygiene (good PMS matching, CAC by channel), then launch quick pilots (reminders, reactivations). Once you see lifts in LTV, CAC, or operational slack, double down. Most of the value is compounding beneath what’s visible on your first dashboard, if you bother to look and measure correctly, you’ll find it.


June 26, 2026
10 min
Discover practical strategies to improve patient retention, strengthen trust, encourage referrals, and create lasting relationships that support sustainable dental practice growth.
June 26, 2026
10 mins
Discover the differences between lead tracking and revenue tracking, and learn how connecting marketing efforts to production and collections drives sustainable practice growth.

June 26, 2026
15 min
Discover how to identify patient drop-off points, optimize every stage of the patient journey, improve conversion rates, and turn more inquiries into booked appointments.
Sign Up Now & Someone from Our Team Will Be in Touch Shortly!
Use the form below to send us a message, and we’ll get back to you as soon as we can.
Track every marketing dollar and optimize patient conversions with ConvertLens. Gain valuable insights from your campaigns, ensuring you never miss a potential patient. Maximize ROI and grow your practice effortlessly.
-p-500.webp)