June 26, 2026
10 min
Discover practical strategies to improve patient retention, strengthen trust, encourage referrals, and create lasting relationships that support sustainable dental practice growth.
November 3, 2025
8 min
Year 1 clinics often break even or see -10% to +10% ROI. By Year 2, ROI rises 10–30 points with lower CAC, higher patient LTV, and better ops. Key levers: attribution, retention, and efficiency.

One of the earliest questions when starting a clinic is: what kind of ROI should I actually expect, and when? Most clinics spend the first year in the red or barely breaking even. There’s a reason: setup costs, early marketing, and those slow initial patient months overhang year-one numbers. By year two, though, the game flips; costs start amortizing, patient traffic is steadier, and operational tweaks begin to stick. Here’s the gist: Year 1 ROI typically lives between -10% and +10% (the spread depending on niche and ambition). Year 2 usually jumps ahead by 10 to 30 points. And the actual levers you can push hardest? 1) Reducing CAC (get attribution right, rethink your channel mix), 2) boosting Patient LTV (via retention and x-sell), and 3) tightening operational throughput.
Table: Year 1 vs Year 2 Clinic ROI Benchmarks
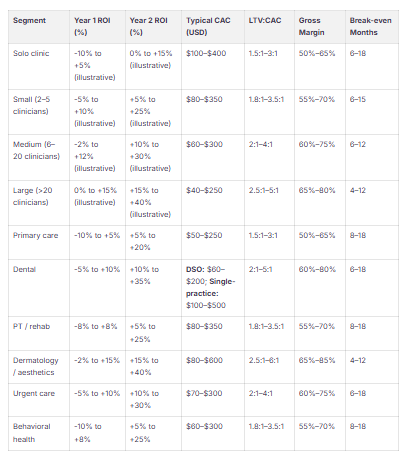
Key Observations:
Ranges move with your mix: referral vs. Google Ads, payer type, and how much expensive gear you need. With AI-driven marketing, some clinics have slashed CAC dramatically (think $247 down to $131) and spiked LTV, so those high Year‑2 ROIs aren’t out of reach if you wire up analytics and are relentless about attribution and follow-up.
Plugging PMS into ROI analytics and a modern Lead CRM isn’t a luxury, it’s table stakes. Direct integrations (like ConvertLens, Clerri, etc.) let you tie together billing, scheduling and leads for a real-world picture of ARPV and retention. In the wild, AI-attribution has produced double-digit drops in CPA (as low as $131 from $247) and vendor claims abound for double-digit LTV improvements and big ad-spend drops. It all boils down to one testable hypothesis: attribution plus rapid, automated lead routing delivers outsize ROI. If you aren’t measuring it, you’re the one being measured. For practical guidance on dashboard setup and interpretation, see How to Read Performance Dashboards and for tracking engagement specifically, see How to Use Data Dashboards to Track Patient Engagement.
Here are three scenarios (Conservative / Base / Growth) for small, medium and large clinics. Pro-forma, and yours should always swap in your actual ARPV, CAC and margins instead of industry swag.
Suppose a 20% CAC cut (from $250 to $200) and a 20% retention bump combine. Your LTV:CAC doesn’t creep, it doubles (from 0.79 to ~2.06); payback nearly halves, crashing from almost 18 months to something like 7–9 months. Little changes compound fast. This isn’t optimism, it’s math.
AI-powered campaign and attribution work shows practical impact: documented drops in CPA, LTV upswings, and less wasted spend. The system-level shift is linking PMS, ROI analytics and a CRM so you can reallocate to top LTV channels and close the gap from lead to booking, the difference between staggering along at Year 1 numbers and vaulting up the Year 2 curve.

What’s a reasonable ROI for clinics in the first two years?
Year 1, assume you’re scraping 0, maybe breaking even, maybe a loss. Year 2? You should be seeing strong single- or even double-digit ROI, assuming you’re tracking right and optimizing fast.
When do you really hit break-even?
Standard is 6–24 months. High-margin specialties move faster; clinics loading up on CapEx (imaging, lasers, big leaseholds) take longer.
How much should you expect CAC to run?
It depends, specialty, channel, region all factor in, but back into it with a 3:1 LTV:CAC target. Don’t exceed it or you’re running for vanity, not profit.
How does payer mix impact ROI across years?
Push higher commercial, minimize uninsured/Medicaid: higher ARPV, shorter payback. If mix shifts, so does ROI.
Which levers reliably move ROI year over year?
Lower CAC, up retention and LTV, plug coding/billing losses, and run with tools that give you visibility (ROI analytics and Lead CRM to pinpoint attribution and lag).
Staffing: when should you add to your team?
Use utilization and cash flow as your light, don’t hire until you hit productivity or throughput targets. KPIs per FTE are your best defense against overstaffing.
How do you get a real CAC number?
Integrate PMS with ROI dashboards and your Lead CRM. It’s data plumbing: Once you tie spend/lead outcomes/ARPV together, you get accuracy.
What’s a realistic target for lead response time?
Aim for under 15 minutes. Quicker = more bookings. Practice benchmarks often show 20–40% lift with rapid routing.
Does AI-driven attribution matter for CAC and LTV?
Yes. Hard numbers: Client cited CPA drop from $247 to $131. Overall, AI campaign optimization can shave 47% off acquisition cost and lift LTV by a third.
Are integrated platforms worth it?
Whether ConvertLens or similar, tying PMS, CRM, and ROI analytics means faster lead response, real attribution, and, on the numbers, better Year 2 ROI with lower CAC.


June 26, 2026
10 min
Discover practical strategies to improve patient retention, strengthen trust, encourage referrals, and create lasting relationships that support sustainable dental practice growth.
June 26, 2026
10 mins
Discover the differences between lead tracking and revenue tracking, and learn how connecting marketing efforts to production and collections drives sustainable practice growth.

June 26, 2026
15 min
Discover how to identify patient drop-off points, optimize every stage of the patient journey, improve conversion rates, and turn more inquiries into booked appointments.
Sign Up Now & Someone from Our Team Will Be in Touch Shortly!
Use the form below to send us a message, and we’ll get back to you as soon as we can.
Track every marketing dollar and optimize patient conversions with ConvertLens. Gain valuable insights from your campaigns, ensuring you never miss a potential patient. Maximize ROI and grow your practice effortlessly.
-p-500.webp)